A-Levels: The Model is not the Student
Eighteen and dreaming of the future must be hard in 2020. Can you even count how many apocalypses, disasters and fascists there are? Eighteen and wondering which one is going to ruin you. For many they just found out: A-Level results. Obviously it has gone catastrophically wrong, but why? To summarise, mistakes have occurred throughout, but I am going to focus on two key technical mistakes. 1) The experimental design is faulty, leaving all conclusions unsupported and 2) the core algorithm is mathematically unsound, generating results that are problematic.
Let’s start with the model used by Ofqual to predict grades (p85 onwards of their 319 page report). Each school submits a list of their students from worst student to best student (it included teacher suggested grades, but they threw those away for larger cohorts). Ofqual then takes the distribution of grades from the previous year, applies a little magic to update them for 2020, and just assigns the students to the grades in rank order. If Ofqual predicts that 40% of the school is getting an A then that’s exactly what happens, irrespective of what the teachers thought they were going to get. If Ofqual predicts that 3 students are going to get a U then you better hope you’re not one of the three lowest rated students. And so on.
The objections appear obvious, with the dropping of teacher predictions implicitly being highlighted by the Scottish solution (BBC). But teachers only estimate the right grade 50% of the time (p15), so mathematically speaking that’s a reasonable decision. Teachers do however rank students quite well, with Ofqual claiming a correlation of at least 0.76 (p15), though other researchers have suggested much lower numbers. But if we take Ofqual's correlation at face value then that is not an unreasonable decision. The actual problem is much more fundamental: They made basic mistakes that invalidate every conclusion they reached.
One thing they did right was they measured if their model discriminates. To do this they imagined it was a year ago (p48): They ran their model on 2019 and compared the results to the known exam results. From this they concluded that they predict the right grade 40% to 75% of the time (depending on subject), and that their model is fair. But they made a fatal substitution, leaving this assessment in tatters. Teachers only provide estimates of their students' grades during normal years. Ranks are not included. In search of a ranking to use, they used the actual 2019 A-Level results (p49). This is simply wrong. Let's explain the last part of the algorithm again. You’re given two lists, one of students with ranks, the other a list of grades to hand out.
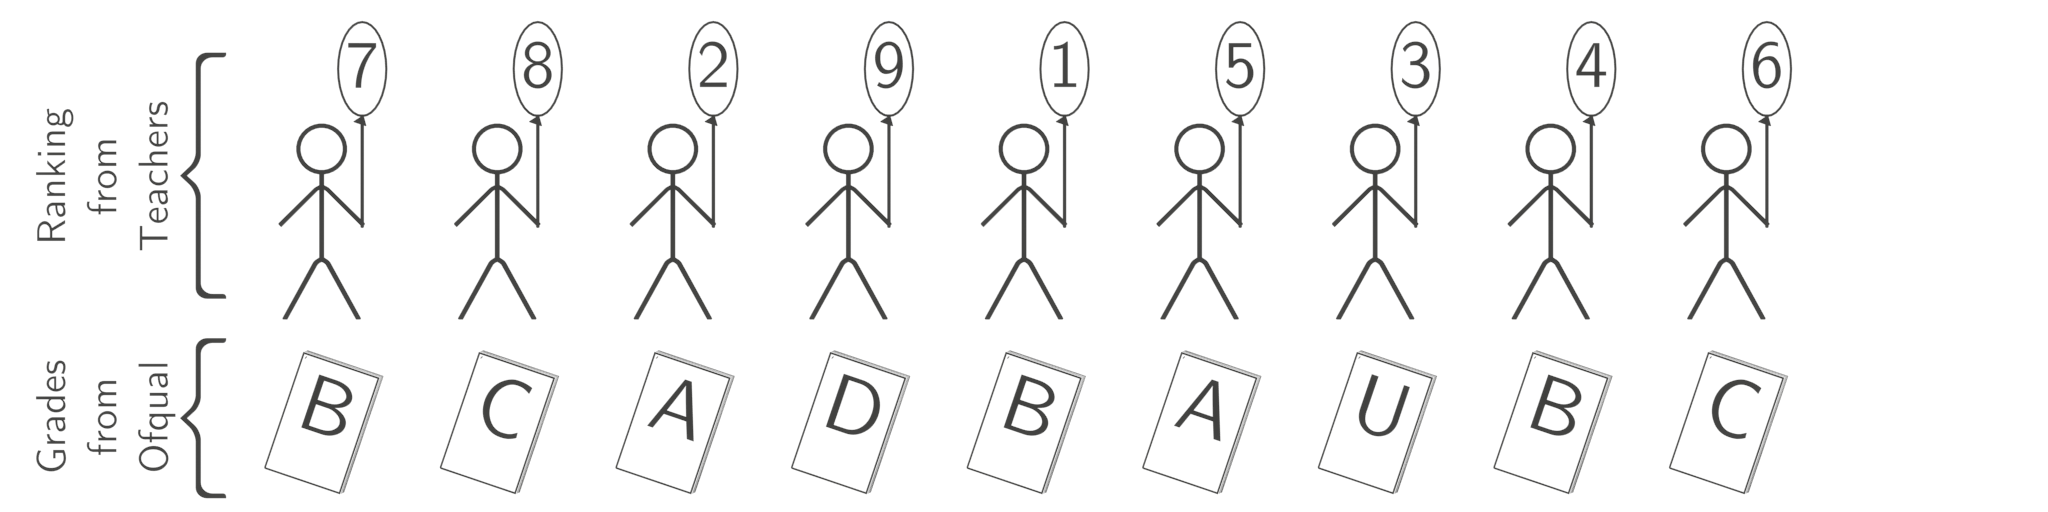
All the algorithm does is sort the two two lists from worst to best and then pair them up.
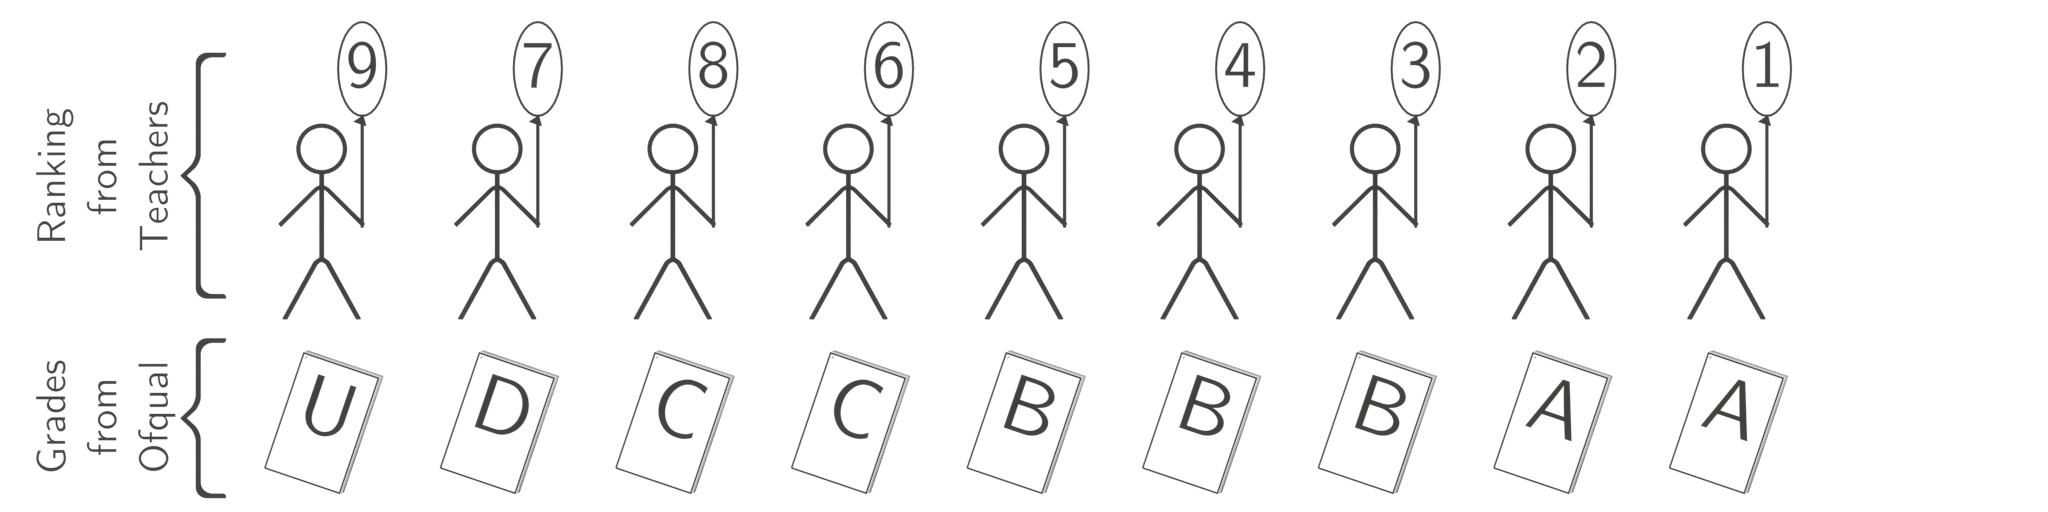
That’s it. The difficulty is that you don’t actually know either list, so do your best to estimate them both. Teachers choose the order, Ofqual chooses the grades (as a grade distribution). But when testing the system they used the actual, known order that the 2019 cohort of students were assigned by the 2019 exams: they only guessed one of the two lists. This is a different and far easier problem. This is referred to as data leakage: it’s the artificial intelligence equivalent of sneaking notes into an exam. It’s cheating: they have given the model the 2019 exam results and then asked it to predict the 2019 exam results! Consequently, there is no reason to believe that solving the flawed 2019 version of the problem will tell you anything about how well the algorithm will perform on the 2020 problem.
That they only got 40% to 75% accuracy is a consequence of having to predict the current year's distribution from the previous years; because the 2019 ranking is perfect it can’t reduce the accuracy from 100%. We simply don’t know what the true accuracy is, but it will be lower than reported. More critically, the ranking generated by the teachers is, I’m sorry to say, a key moment when racism and other forms of nastiness are introduced into the system. One of the arguments for moving the university application process to the summer, after grades have come out, is to protect minorities from this effect (The Guardian). By replacing a teacher ranking with a ranking derived from grades, where students are accessed anonymously, their skin colour, gender, disability status and poverty all hidden, they invalidated the entire analysis. We can throw away over half of the report as utter rubbish, particularly all claims about it being fair. It should also be noted that they had 11 models, from which they chose the best performing: the model they selected is the one that is best designed to exploit the 2019 flaw, and almost certainly not the best model they created with respect to their implied objective.
We can at this point stop. With the evidence that they did the right thing being faulty, the only sensible response is for the marks to be withdrawn and the analysis redone. But if we stop here they might correct the above mistake, sneak into the night and commit some more mistakes. When hammering in a stake you don’t stop when the vampire stops flailing. You keep going until it comes out the other side, pack the coffin with salt and lock it, before collapsing a mansion on top. After all, even with faulty evidence of it being a good choice you could still presume that the model is doing something sensible.
40% to 75% accuracy seems very low considering how easy their flawed problem is. Why is it so low? Simply put, students vary. A lot. Remember that we’re discussing people, not numbers. By forcing a mark distribution on the results they disallowed variability. This is an objection many people are picking up on, and it’s entirely valid. Anyone who worked hard has been put back into their place, given the perfect demonstration that the American dream most certainly doesn’t apply to the UK (it doesn’t to the USA, but that’s another discussion). And the lazy types who were too busy with other activities find their marks inflated.
But let’s get back to the algorithm itself, specifically where they update the previous year’s grade distribution to the current year (p86 onwards). They know grades change each year because of the variability in the students, but that was measured: This is where each student's GCSE grades are introduced. The assumption is that a school takes a group of students and improves them. If better students turn up on day one then the school produces better students for sitting exams. Whether you believe this or not (I don’t) it’s all that Ofqual has, so it’s what they use - a least terrible option, and hard to see how they could do better. Unfortunately they do it wrong.
Let's imagine a school with the following grades,
and another school that is doing much better,
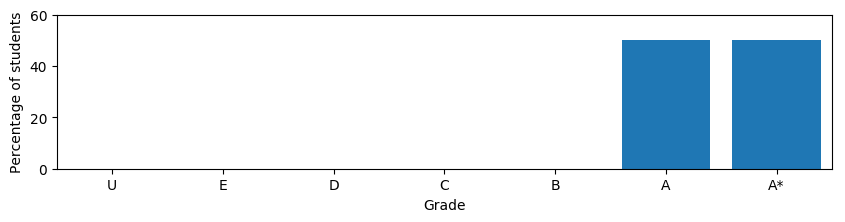
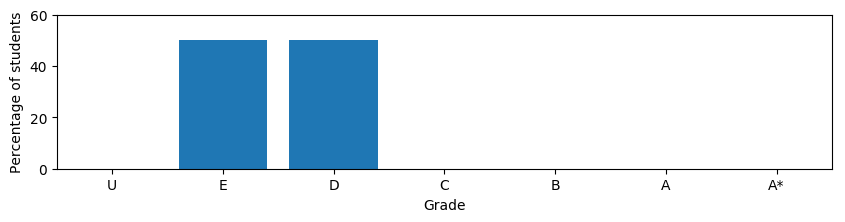
What would you consider to be a school half way between these two extremes? Most people would choose something like
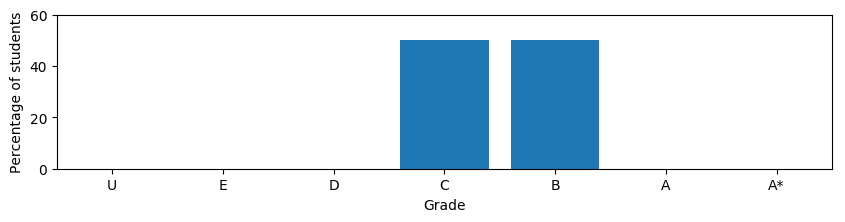
but Ofqual went with the utterly strange
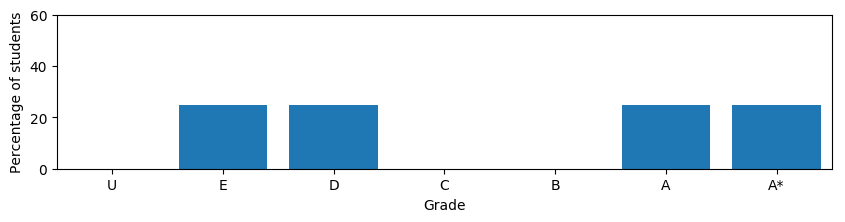
For the technically minded the sensible option is referred to as a Wasserstein barycenter while Ofqual went with L1 interpolation (this is the weighted average of cumulative probability distributions used on p93 and elsewhere). This matters because this technique is used when adjusting the grades from one year to the next (p93). Imagine a school's 2019 students did really badly at their GCSEs, such that the model predicts Es and Ds for all of them. This years cohort however, did much better, and is predicted As and A*s based on their GCSE results. Under some conditions the scenario above will then play out: The worst students in the cohort will be awarded Es and Ds, the best As and A*s, the middle left vacant. You get a lag in the update which means an improving school leaves the weaker students behind, a declining school leaves the high scoring students “behind”, with a higher grade. In the majority of cases it gives an advantage to the top students and hurts those who are struggling. In practise this effect will be subtle, as the predictions are not very certain, but this approach will accentuate the biases of the school system even further. In practise their equation is more complicated than suggested above, and the effect even worse in some cases. It’s also possible, though unlikely, to get negative probabilities out of their model. It must have happened at least once, so someone at Ofqual must have seen a school was assigned, say, -5% Bs, and chosen to ignore this absurdity.
To make the above easier to understand I've created an interactive visualisation. It includes both scenarios and the ability to change the distributions and see what happens!
With 319 pages the Ofqual report is far longer than can be read in the time I’ve had available. I’ve ignored the effects of small class sizes as others have already reported on it. Also, the rounding behaviour (The Guardian) is just cruel. There are almost certainly many more daemons within its pages and I’ve no doubt that this will make an excellent case study for future classes on the ethics of using artificial intelligence. I will raise two further issues. First is the mindless use of accuracy as a measure of performance. It was deemed acceptable to consider a prediction of U for a student deserving an A to be exactly as bad as predicting the same student an A*. That is patently absurd. Secondly, it’s disturbing how often computational issues are mentioned (p60, p168, ...). This problem is tiny and could be run on a £35 Raspberry Pi, which makes me wonder about their technical expertise and the possible bugs that may have snuck in. An external code review is essential.
So how do you fix this? That’s a hard question, even before we consider the politics, as at some level this is an impossible problem. But you can certainly do better, and indeed a few of the other models they proposed in the report are likely to do so, once the mechanism for judging which one is best is fixed. The obsession with thinking in terms of schools rather than individual students needs to go, especially as this appears to disproportionately benefit private schools, and the algorithm needs to be modified to output how certain it is. Once it does that the teacher’s grade estimates can be figured back into the modelling. While they may not be perfect, they are human, and we do accept them as something more than the distant judgment of a poorly executed machine. One way to achieve this is to use a causal structural equation model (“Book of Why”, by Pearl & Mackenzie). This would consider every student individually in terms of what causes them to be good, taking into account as much of their background information as is available. It can handle missing information in a clean and elegant way, and use the teacher's grade as a source of information as well. More importantly, such models can explain their decisions: they can tell you why they gave you a grade. Politically such a model might be harder for politicians to support, as students, parents, teachers and the public might be less accepting of a model telling them that a demographic detail has influenced their grade by some small fraction of a grade. The black box model currently deployed, being opaque, is unfortunately much easier to defend.
However, denying explanations to students is almost as cruel as giving them the wrong grades. Without knowing why, even if it’s the feeling of dread as you realise you're failing an exam, the pain can only be amplified by the incomprehension of why, combined with the feeling of powerlessness it brings. This abuse lies at the heart of why this is a terrible example of using artificial intelligence to make life altering decisions. The government, via the Alan Turing Institute, has published a set of principles that apply to this situation (Understanding Artificial Intelligence Ethics and Safety). These are the “FAST Track Principles”, requiring fairness, accountability, sustainability and transparency. It’s doubtful any student subjugated to this would consider any of these principles to have been followed, especially as outside Ofqual no one has actually seen the system that was built to predict their futures.
So there is a lot wrong, but whose fault is it? It’s easy to blame the statisticians who performed the analysis, but that’s unfair. Ofqual is probably under-resourced when it comes to statisticians, and there hasn’t been a lot of time to put this all together. In practise I’ve glossed over 95% of the analysis: cleaning up data, handling edge cases, all the weird rules you need for rare situations (e.g. What do you do with homeschooled students?). From teaching MSc students I can tell you that half the class would make at least one of the mistakes on display working under such conditions, particularly with the extra stress of a pandemic. The problem is with management: they should have asked for help. Faced with a problem this complex and this important they needed to bring in external checkers. They needed to publish the approach months ago, so it could be widely read and mistakes found. While the fact they published the algorithm at all is to be commended (if possibly a legal requirement due to the GDPR right to an explanation), they didn’t go anywhere near far enough. Publishing their implementations of the models used would have allowed even greater scrutiny, including bug hunting. It is, of course, not too late to do this. While more speculative, it can be observed that all 11 of the algorithms that were tried were designed to match each school's target distribution exactly, not the grades, often as a result of the mathematical equivalent of hitting them with a sledgehammer. It seems likely that upper management mandated this as a requirement without any understanding of the consequences. And finally, should this even have been attempted? I’ve focused on the algorithm and mostly ignored the ethical issues. The very idea of fairly guessing a student's grade is problematic, and only acceptable if you forget we are discussing real people, with individuality, dreams and purpose. They would have certainly been happier sitting their exams, whatever it took to do so safely.
Ultimately, the government can only receive, at best, a D for their efforts; they tried but failed. We can only hope they will now pull themselves up, bring in the experts, and construct an algorithm worthy of an A.
Edit 2020-8-15: Added link to visualisation code.
Edit 2020-8-16: Removed Gavin Williamson quote as it turns out to be false. Still resulted in some cutting humour though!
Edit 2020-8-17: Qualified language around correlation of teacher rankings with true rankings and toned down support for their approach accordingly.
Media involving me that came about because of the above:
BBC News TV
Panellist on Roundtable,a debate show on TRT World
BBC News Website
Financial Times
Telegraph
Was also on both BBC Radio 5 Live and TalkRadio (twice).
In the burst of traffic from this going a little bit viral more than 17K unique people read this page!
Was cited in "Becoming a Teacher: Issues in Secondary Education 6e" by Simon Gibbons, Melissa Glackin, Elizabeth Rushton, Emma Towers and Richard Brock.
Was cited in "Managing new technology: The combination of model risk and enterprise risk management" by Eleanor Toye Scott, Philip Stiles, and Pradeep Debata.
Let’s start with the model used by Ofqual to predict grades (p85 onwards of their 319 page report). Each school submits a list of their students from worst student to best student (it included teacher suggested grades, but they threw those away for larger cohorts). Ofqual then takes the distribution of grades from the previous year, applies a little magic to update them for 2020, and just assigns the students to the grades in rank order. If Ofqual predicts that 40% of the school is getting an A then that’s exactly what happens, irrespective of what the teachers thought they were going to get. If Ofqual predicts that 3 students are going to get a U then you better hope you’re not one of the three lowest rated students. And so on.
The objections appear obvious, with the dropping of teacher predictions implicitly being highlighted by the Scottish solution (BBC). But teachers only estimate the right grade 50% of the time (p15), so mathematically speaking that’s a reasonable decision. Teachers do however rank students quite well, with Ofqual claiming a correlation of at least 0.76 (p15), though other researchers have suggested much lower numbers. But if we take Ofqual's correlation at face value then that is not an unreasonable decision. The actual problem is much more fundamental: They made basic mistakes that invalidate every conclusion they reached.
One thing they did right was they measured if their model discriminates. To do this they imagined it was a year ago (p48): They ran their model on 2019 and compared the results to the known exam results. From this they concluded that they predict the right grade 40% to 75% of the time (depending on subject), and that their model is fair. But they made a fatal substitution, leaving this assessment in tatters. Teachers only provide estimates of their students' grades during normal years. Ranks are not included. In search of a ranking to use, they used the actual 2019 A-Level results (p49). This is simply wrong. Let's explain the last part of the algorithm again. You’re given two lists, one of students with ranks, the other a list of grades to hand out.
All the algorithm does is sort the two two lists from worst to best and then pair them up.
That’s it. The difficulty is that you don’t actually know either list, so do your best to estimate them both. Teachers choose the order, Ofqual chooses the grades (as a grade distribution). But when testing the system they used the actual, known order that the 2019 cohort of students were assigned by the 2019 exams: they only guessed one of the two lists. This is a different and far easier problem. This is referred to as data leakage: it’s the artificial intelligence equivalent of sneaking notes into an exam. It’s cheating: they have given the model the 2019 exam results and then asked it to predict the 2019 exam results! Consequently, there is no reason to believe that solving the flawed 2019 version of the problem will tell you anything about how well the algorithm will perform on the 2020 problem.
That they only got 40% to 75% accuracy is a consequence of having to predict the current year's distribution from the previous years; because the 2019 ranking is perfect it can’t reduce the accuracy from 100%. We simply don’t know what the true accuracy is, but it will be lower than reported. More critically, the ranking generated by the teachers is, I’m sorry to say, a key moment when racism and other forms of nastiness are introduced into the system. One of the arguments for moving the university application process to the summer, after grades have come out, is to protect minorities from this effect (The Guardian). By replacing a teacher ranking with a ranking derived from grades, where students are accessed anonymously, their skin colour, gender, disability status and poverty all hidden, they invalidated the entire analysis. We can throw away over half of the report as utter rubbish, particularly all claims about it being fair. It should also be noted that they had 11 models, from which they chose the best performing: the model they selected is the one that is best designed to exploit the 2019 flaw, and almost certainly not the best model they created with respect to their implied objective.
We can at this point stop. With the evidence that they did the right thing being faulty, the only sensible response is for the marks to be withdrawn and the analysis redone. But if we stop here they might correct the above mistake, sneak into the night and commit some more mistakes. When hammering in a stake you don’t stop when the vampire stops flailing. You keep going until it comes out the other side, pack the coffin with salt and lock it, before collapsing a mansion on top. After all, even with faulty evidence of it being a good choice you could still presume that the model is doing something sensible.
40% to 75% accuracy seems very low considering how easy their flawed problem is. Why is it so low? Simply put, students vary. A lot. Remember that we’re discussing people, not numbers. By forcing a mark distribution on the results they disallowed variability. This is an objection many people are picking up on, and it’s entirely valid. Anyone who worked hard has been put back into their place, given the perfect demonstration that the American dream most certainly doesn’t apply to the UK (it doesn’t to the USA, but that’s another discussion). And the lazy types who were too busy with other activities find their marks inflated.
But let’s get back to the algorithm itself, specifically where they update the previous year’s grade distribution to the current year (p86 onwards). They know grades change each year because of the variability in the students, but that was measured: This is where each student's GCSE grades are introduced. The assumption is that a school takes a group of students and improves them. If better students turn up on day one then the school produces better students for sitting exams. Whether you believe this or not (I don’t) it’s all that Ofqual has, so it’s what they use - a least terrible option, and hard to see how they could do better. Unfortunately they do it wrong.
Let's imagine a school with the following grades,
and another school that is doing much better,
What would you consider to be a school half way between these two extremes? Most people would choose something like
but Ofqual went with the utterly strange
For the technically minded the sensible option is referred to as a Wasserstein barycenter while Ofqual went with L1 interpolation (this is the weighted average of cumulative probability distributions used on p93 and elsewhere). This matters because this technique is used when adjusting the grades from one year to the next (p93). Imagine a school's 2019 students did really badly at their GCSEs, such that the model predicts Es and Ds for all of them. This years cohort however, did much better, and is predicted As and A*s based on their GCSE results. Under some conditions the scenario above will then play out: The worst students in the cohort will be awarded Es and Ds, the best As and A*s, the middle left vacant. You get a lag in the update which means an improving school leaves the weaker students behind, a declining school leaves the high scoring students “behind”, with a higher grade. In the majority of cases it gives an advantage to the top students and hurts those who are struggling. In practise this effect will be subtle, as the predictions are not very certain, but this approach will accentuate the biases of the school system even further. In practise their equation is more complicated than suggested above, and the effect even worse in some cases. It’s also possible, though unlikely, to get negative probabilities out of their model. It must have happened at least once, so someone at Ofqual must have seen a school was assigned, say, -5% Bs, and chosen to ignore this absurdity.
To make the above easier to understand I've created an interactive visualisation. It includes both scenarios and the ability to change the distributions and see what happens!
With 319 pages the Ofqual report is far longer than can be read in the time I’ve had available. I’ve ignored the effects of small class sizes as others have already reported on it. Also, the rounding behaviour (The Guardian) is just cruel. There are almost certainly many more daemons within its pages and I’ve no doubt that this will make an excellent case study for future classes on the ethics of using artificial intelligence. I will raise two further issues. First is the mindless use of accuracy as a measure of performance. It was deemed acceptable to consider a prediction of U for a student deserving an A to be exactly as bad as predicting the same student an A*. That is patently absurd. Secondly, it’s disturbing how often computational issues are mentioned (p60, p168, ...). This problem is tiny and could be run on a £35 Raspberry Pi, which makes me wonder about their technical expertise and the possible bugs that may have snuck in. An external code review is essential.
So how do you fix this? That’s a hard question, even before we consider the politics, as at some level this is an impossible problem. But you can certainly do better, and indeed a few of the other models they proposed in the report are likely to do so, once the mechanism for judging which one is best is fixed. The obsession with thinking in terms of schools rather than individual students needs to go, especially as this appears to disproportionately benefit private schools, and the algorithm needs to be modified to output how certain it is. Once it does that the teacher’s grade estimates can be figured back into the modelling. While they may not be perfect, they are human, and we do accept them as something more than the distant judgment of a poorly executed machine. One way to achieve this is to use a causal structural equation model (“Book of Why”, by Pearl & Mackenzie). This would consider every student individually in terms of what causes them to be good, taking into account as much of their background information as is available. It can handle missing information in a clean and elegant way, and use the teacher's grade as a source of information as well. More importantly, such models can explain their decisions: they can tell you why they gave you a grade. Politically such a model might be harder for politicians to support, as students, parents, teachers and the public might be less accepting of a model telling them that a demographic detail has influenced their grade by some small fraction of a grade. The black box model currently deployed, being opaque, is unfortunately much easier to defend.
However, denying explanations to students is almost as cruel as giving them the wrong grades. Without knowing why, even if it’s the feeling of dread as you realise you're failing an exam, the pain can only be amplified by the incomprehension of why, combined with the feeling of powerlessness it brings. This abuse lies at the heart of why this is a terrible example of using artificial intelligence to make life altering decisions. The government, via the Alan Turing Institute, has published a set of principles that apply to this situation (Understanding Artificial Intelligence Ethics and Safety). These are the “FAST Track Principles”, requiring fairness, accountability, sustainability and transparency. It’s doubtful any student subjugated to this would consider any of these principles to have been followed, especially as outside Ofqual no one has actually seen the system that was built to predict their futures.
So there is a lot wrong, but whose fault is it? It’s easy to blame the statisticians who performed the analysis, but that’s unfair. Ofqual is probably under-resourced when it comes to statisticians, and there hasn’t been a lot of time to put this all together. In practise I’ve glossed over 95% of the analysis: cleaning up data, handling edge cases, all the weird rules you need for rare situations (e.g. What do you do with homeschooled students?). From teaching MSc students I can tell you that half the class would make at least one of the mistakes on display working under such conditions, particularly with the extra stress of a pandemic. The problem is with management: they should have asked for help. Faced with a problem this complex and this important they needed to bring in external checkers. They needed to publish the approach months ago, so it could be widely read and mistakes found. While the fact they published the algorithm at all is to be commended (if possibly a legal requirement due to the GDPR right to an explanation), they didn’t go anywhere near far enough. Publishing their implementations of the models used would have allowed even greater scrutiny, including bug hunting. It is, of course, not too late to do this. While more speculative, it can be observed that all 11 of the algorithms that were tried were designed to match each school's target distribution exactly, not the grades, often as a result of the mathematical equivalent of hitting them with a sledgehammer. It seems likely that upper management mandated this as a requirement without any understanding of the consequences. And finally, should this even have been attempted? I’ve focused on the algorithm and mostly ignored the ethical issues. The very idea of fairly guessing a student's grade is problematic, and only acceptable if you forget we are discussing real people, with individuality, dreams and purpose. They would have certainly been happier sitting their exams, whatever it took to do so safely.
Ultimately, the government can only receive, at best, a D for their efforts; they tried but failed. We can only hope they will now pull themselves up, bring in the experts, and construct an algorithm worthy of an A.
Edit 2020-8-15: Added link to visualisation code.
Edit 2020-8-16: Removed Gavin Williamson quote as it turns out to be false. Still resulted in some cutting humour though!
Edit 2020-8-17: Qualified language around correlation of teacher rankings with true rankings and toned down support for their approach accordingly.
Media involving me that came about because of the above:
BBC News TV
Panellist on Roundtable,a debate show on TRT World
BBC News Website
Financial Times
Telegraph
Was also on both BBC Radio 5 Live and TalkRadio (twice).
In the burst of traffic from this going a little bit viral more than 17K unique people read this page!
Was cited in "Becoming a Teacher: Issues in Secondary Education 6e" by Simon Gibbons, Melissa Glackin, Elizabeth Rushton, Emma Towers and Richard Brock.
Was cited in "Managing new technology: The combination of model risk and enterprise risk management" by Eleanor Toye Scott, Philip Stiles, and Pradeep Debata.